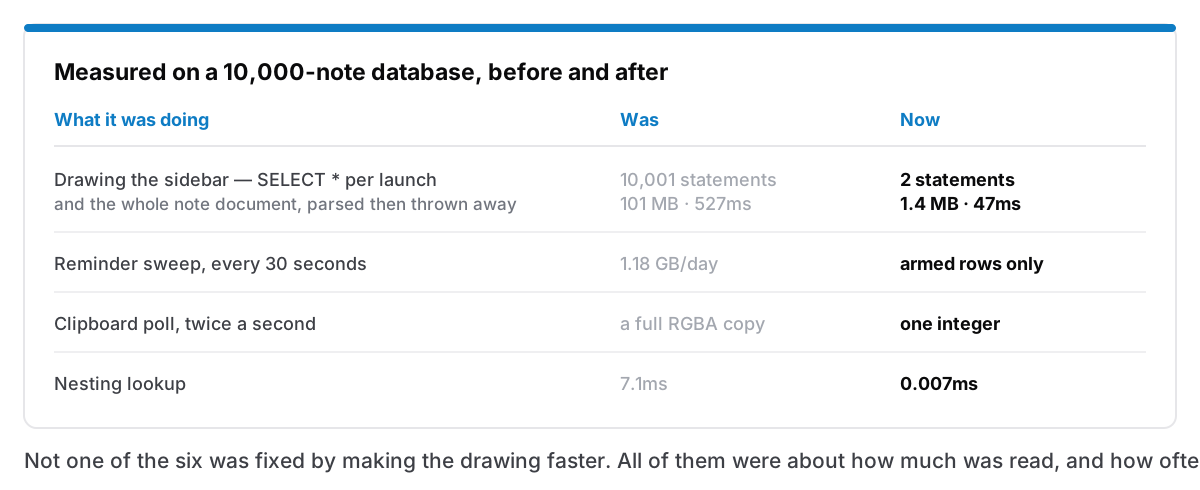
On a database with 10,000 notes, drawing the sidebar took 10,001 statements and moved 101 MB, in order to render about 140 characters of visible text.
Four times per launch.
None of that was a mystery once I looked, and looking was the entire trick. What follows is six problems found in one sitting, all of them measured rather than suspected, several of them in code I had written and read a dozen times without noticing anything wrong.
The sidebar
The list query was SELECT *.
Every row therefore carried its whole rich-text document — the full note, as JSON — across the bridge from the database to the interface, where it was parsed into an object and thrown away, because a sidebar row needs a title and a short snippet. Then, for each note, a second query fetched that note's tags. Hence 10,001 statements: one list, ten thousand tag lookups.
The fix has nothing clever in it. Select the four columns a list row actually needs. Let SQLite cut the snippet, rather than shipping 8 KB of document to take 60 characters off the front. Read a code note's file path with json_extract instead of parsing the entire document in JavaScript to reach one field. Fetch every note's tags in one grouped query instead of ten thousand.
Same database: 2 statements, 1.4 MB, and 527ms became 47ms.
Backlinks got the same treatment, because that one runs on every note open rather than at launch, and was doing the same thing for the same reason.
The idle costs
The sidebar at least happened when something happened. These four ran while the app sat there doing nothing.
The reminder sweep read everything, every 30 seconds. Every to-do and every calendar event, in full, twice a minute, forever, to find out whether anything was due. On the test database — 767 events — that is 1.18 GB a day of reading to almost always learn that the answer is no. It asks for armed rows only now: the ones with a reminder set, in the window. Ninety-nine per cent of that traffic was learning nothing.
The clipboard poll read the clipboard twice a second. Including, if an image was on the pasteboard, a full owned RGBA copy of it. Every half second. Forever. macOS offers NSPasteboard.changeCount, a single integer that increments when the contents change. The poll reads the integer and touches the actual contents only when it moves. A copied screenshot now costs something once, when you copy it, instead of 172,800 times a day.
The status bar split the entire note into words on every keystroke. Word count. On a long document, on every character typed. That is the sort of thing that feels free in a small test note and turns a 5,000-word document into a typing experience people describe as "laggy" without being able to say why.
And the editor re-rendered on any state change at all, because it subscribed to the whole state store rather than the parts it uses. Toggle a setting in a modal on the other side of the app and the heaviest subtree in the application rebuilt itself.
Two more, in the writing path
Saving a note deleted and rewrote its links every time. Every debounced save issued a DELETE plus one INSERT per link — to usually change nothing at all, because the links in a note are stable across most keystrokes. Compare first, write only on a difference.
And startup re-read and re-rendered the entire tree after a housekeeping pass that had deleted nothing. The pass was correct; the unconditional refresh after it was not. If nothing changed, nothing needs redrawing.
The indexes, and the one I did not add
Three indexes went in for lookups whose column was not the leading column of any existing key: note nesting, tag lookups, backlink targets. The nesting one took a query from 7.1ms to 0.007ms.
A fourth looked equally obvious — an index covering the sidebar's own list query — and it was a trap. That query already had a plan SQLite was happy with, and the index would have cost a write on every single save in exchange for a read that was no longer slow. It is not there, and the migration says why, with numbers, because in six months I will look at that query and think the same obvious thought again.
What actually generalises
The bottleneck was never where I thought. I would have guessed rendering — long lists, virtualisation, React. Every one of these was data access: how much was read, how often, and how much of it was thrown away on arrival. Not one of the six was fixed by making the drawing faster.
"It feels fine" means your test data is too small. Every one of these was invisible on the 40-note database I develop against and obvious on a 10,000-note one. Generating a large database and running against it occasionally is the cheapest performance tool there is, and I had not been doing it. Why a notes app should open instantly is the promise; a realistic test database is what makes it true for someone with eight years of notes rather than eight.
Idle cost is invisible and adds up. Nobody files a bug that says "your app read 1.18 GB today while I wasn't using it". They notice their battery, blame something else, and quit the app that happened to be open. A poll that reads one integer instead of copying an image is not a clever optimisation. It is the difference between a menu-bar app that costs nothing and one that quietly costs you an hour of battery.
Measure in the running app, not in a benchmark. The image-paste problem in the clipboard work looked like bandwidth right up until it was isolated and turned out to be a serialisation step costing 2,672ms against 43ms. Anything you believe about where the time goes, without a number beside it, is a guess with good posture.
None of this appears in a changelog. The public note for the release that carried it says "bug fixes and improvements", because the notes are deliberately vague and nobody outside can see any of it directly. What they can see is an app that opens in well under a second on a database with ten years in it, which was the entire point.